RVisLearner - Interactive Data Visualization with R graphics, ggplot2, Shiny
The interactive RVisLearner is a learning app that shows how to create data visualizations with the base R functions hist and plot from the graphics package, and with the corresponding functions of the Tidyverse ggplot2 package. Both the R graphics and the ggplot2 package can be used to plot data as histogram, scatter plot, box plot etc. and the resulting plots are similarly pleasing. They differ in how the arguments are supplied to the functions and in terms of the learning curve.
1 RVisLearner Usage
| Top |
The RVisLearner app has three tab panels, the first one for the data set, the second one for histogram plots, the third tab for scatter plots. Each tab is organized in a sidebar panel and a main panel. The sidebar panel contains general information, the main panel contains collapsible panels for parameter selection, plots and source code.
1-1 The Dataset
| Top |
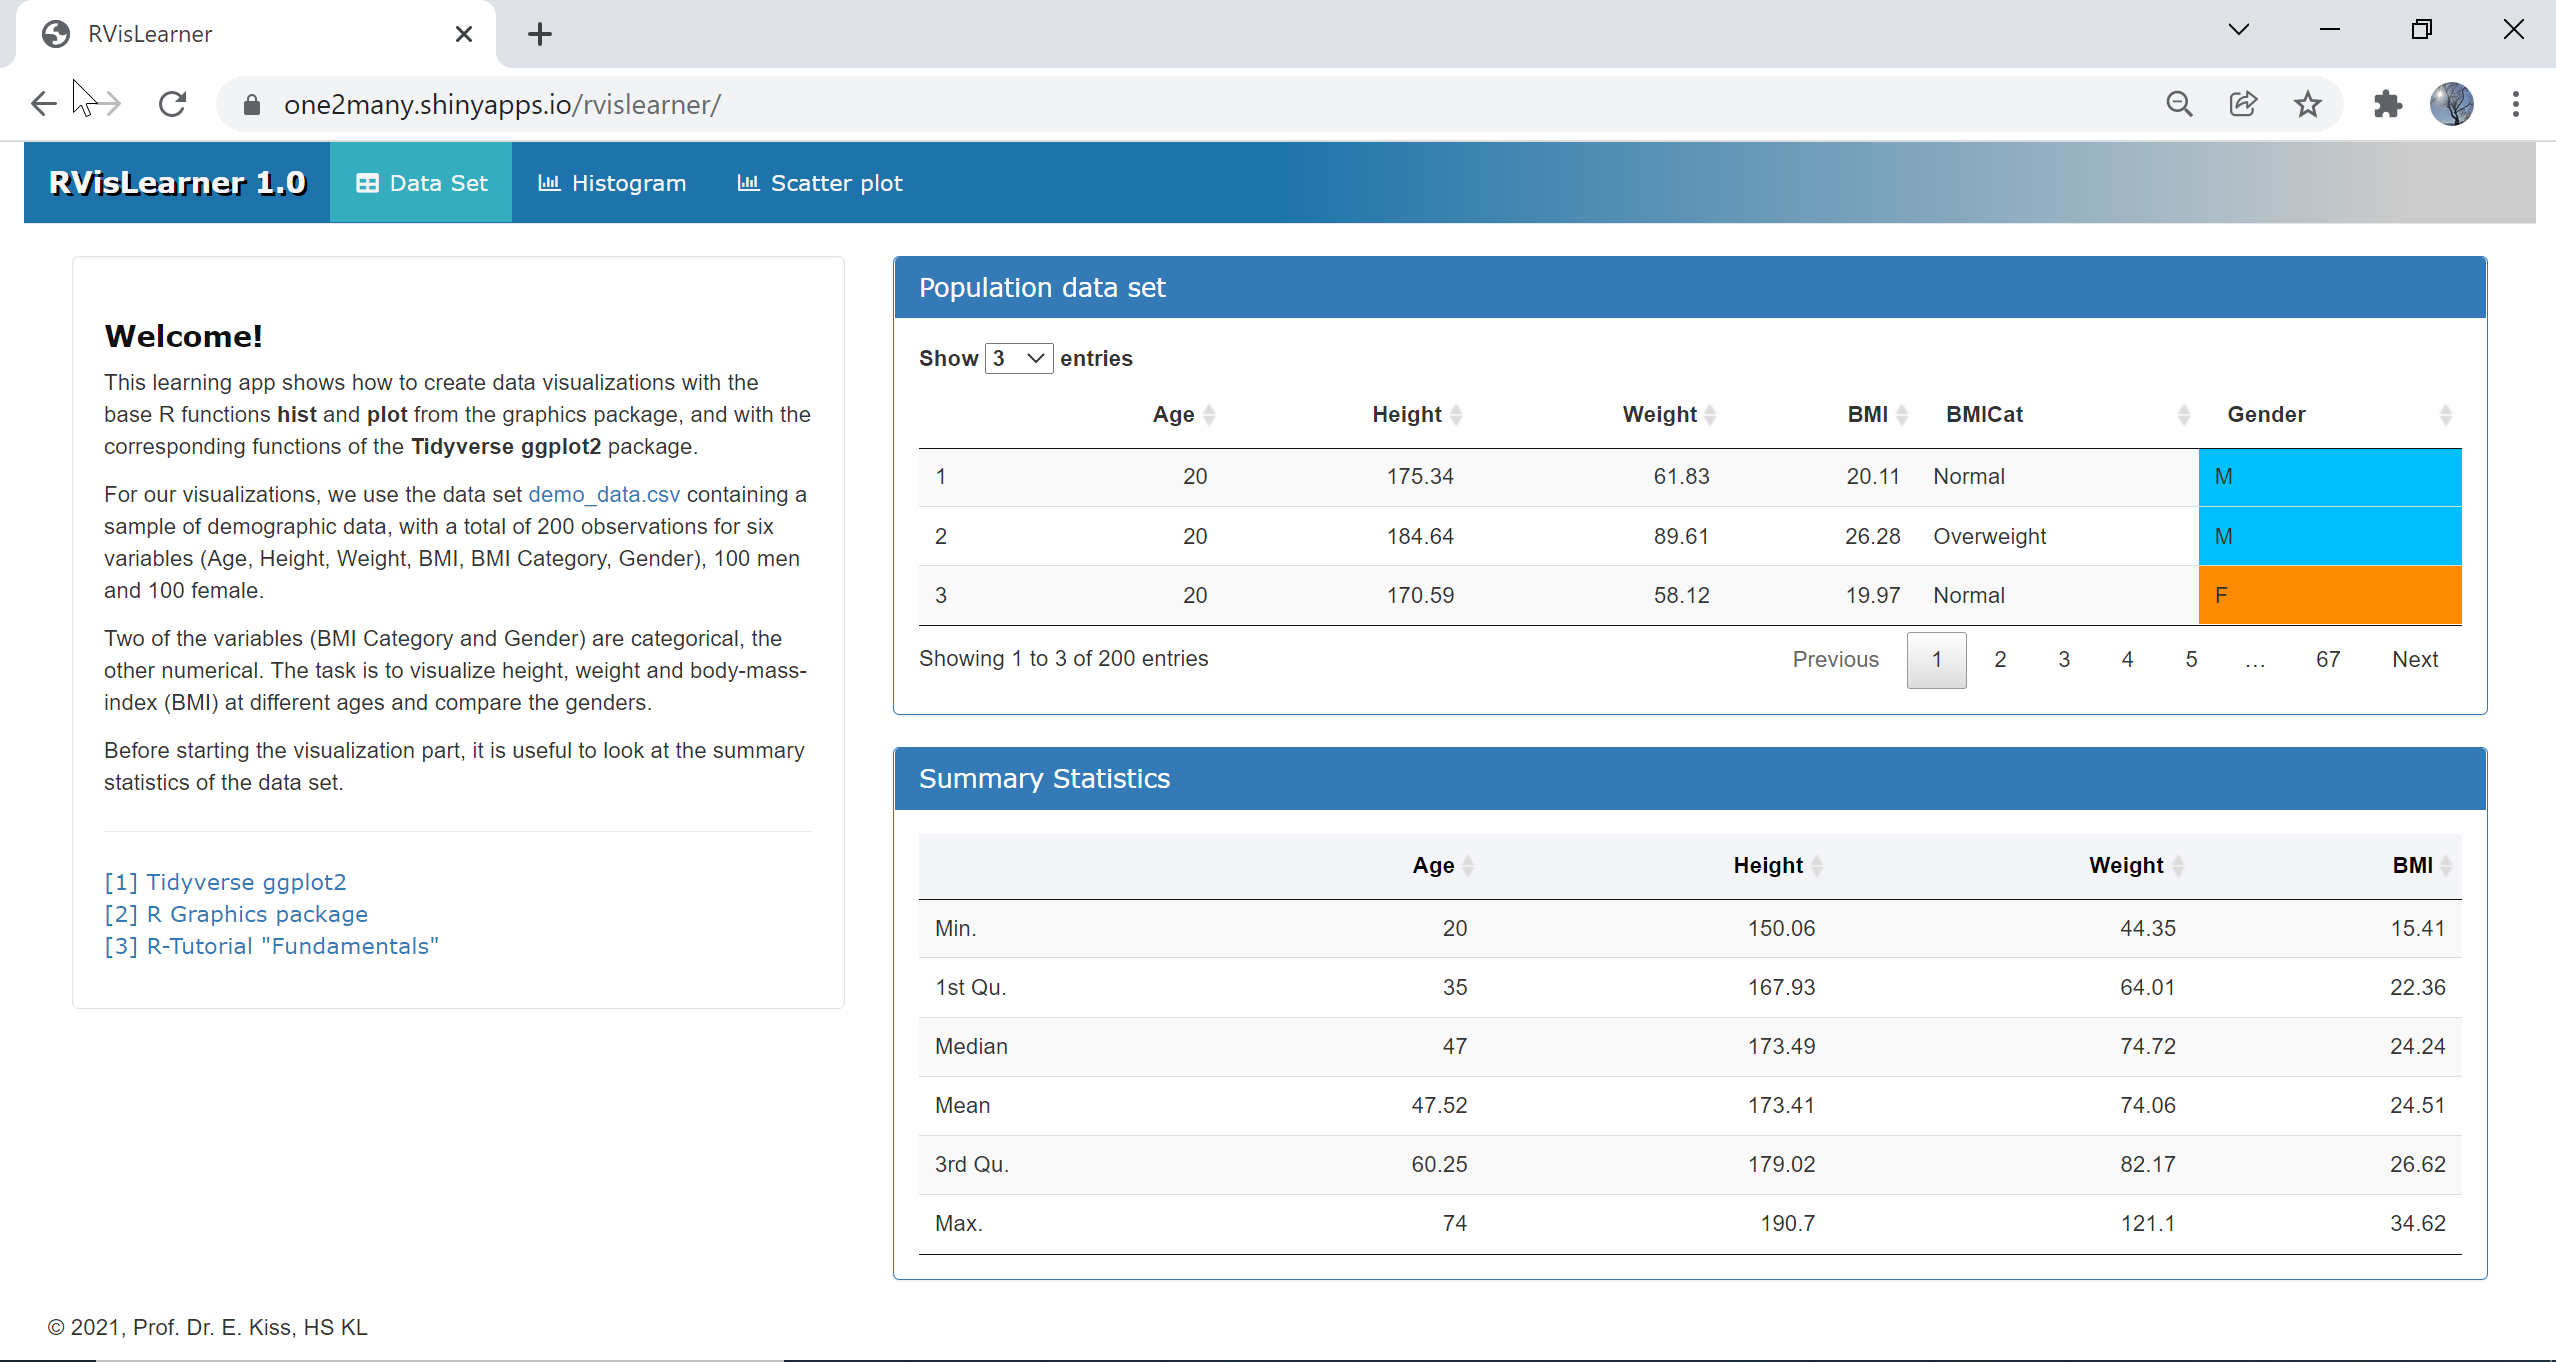
The first tab panel features the dataset. For our visualizations, we use a synthetic data set demo_data.csv containing a sample of demographic data, with a total of 200 observations for six variables (Age, Height, Weight, BMI, BMI Category, Gender), 100 men and 100 female. Two of the variables (BMI Category and Gender) are categorical, the other numerical. The task is to visualize height, weight and body-mass-index (BMI) at different ages and compare the genders. Before starting the visualization part, it is useful to look at the summary statistics of the data set, which can be obtained using the R function summary. This function takes as input an object, for example a data frame, and returns summaries of the results of model fitting functions such as Min, Max, Median, Mean etc.
Example code
The following example code reads the data from a csv file and stores it in a data frame df, then extracts men and women data in two subsets df_m and df_f and creates the summary statistics for the subsets and the entire dataset.
df = read.csv("demo_data.csv",header = TRUE,sep = ",",encoding = 'UTF-8')df_m = subset(df, df$Gender == "M") # mendf_f = subset(df, df$Gender == "F") # womensummary(df_m) # summary statistics mensummary(df_f) # summary statistics womensummary(df) # summary statistics
1-2 Histograms
| Top |
A histogram is the graphic representation of the frequency distribution of a variable. The data of the variable are sorted according to their size and divided into a number of bins that can, but do not have to be, of the same width. A rectangle is drawn above each class, the area of which is proportional to the frequency of this class. A histogram can be a frequency plot, where the area represents the count of elements in this class, or a density plot, where the area represents the percentage of elements in this class.
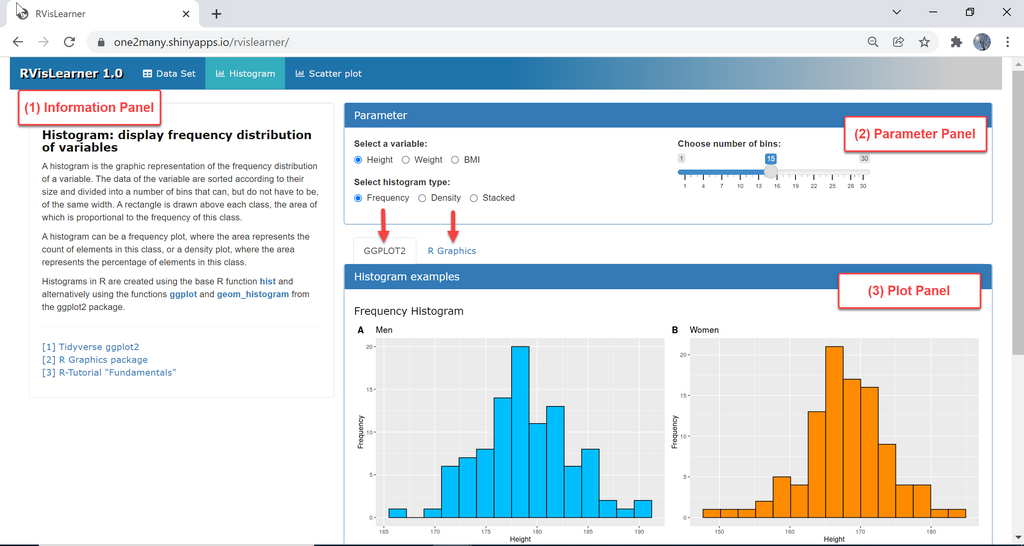
The second tab panel explains the creation of histograms for the example data set. Histograms in R are created using the base R function hist from the graphics package and alternatively using the functions ggplot and geom_histogram from the ggplot2 package. In order to learn the differences between these two packages, select a variable, a histogram type and a package in the Parameter panel and observe the output in the Plot panel, as depicted in the screenshot below.
Example code: Histograms with R graphics vs ggplot2
Histograms created with R graphics
Function hist
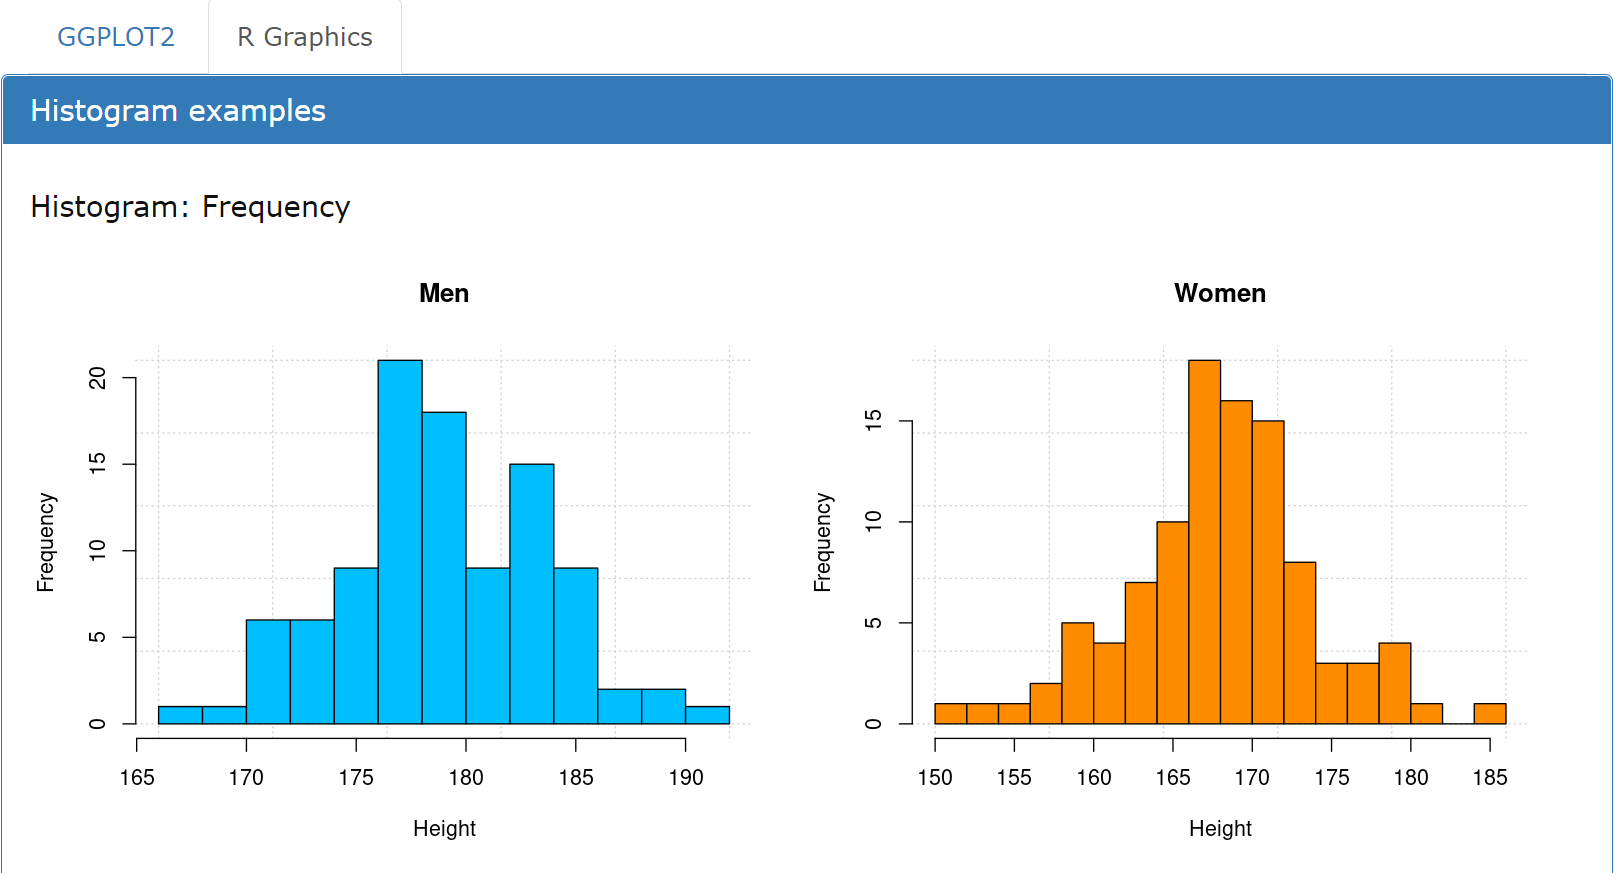
This example code shows how to create two frequency histograms with hist for the column Height. The data for the histogram plot are the columns Height extracted from the data frames df_m and df_f, respectively, and are passed as first argument to the function hist, along with other arguments: the number of breaks, color and title of the plot, labels for the axes and a grid for the plot. The function par arranges the two histogram plots in a layout with 1 row and 2 columns.
df = read.csv("demo_data.csv")df_m = subset(df, df$Gender == "M") # mendf_f = subset(df, df$Gender == "F") # womenx_m = df_m[, "Height"]x_f = df_f[, "Height"]par(mfrow = c(1, 2))c = c("deepskyblue", "darkorange") # colorsh_m = hist(x_m, breaks = 15, col = c[1],xlab = 'Height', ylab = 'Frequency', main = 'Men',panel.first = grid())h_f = hist(x_f, breaks = 15, col = c[2],xlab = 'Height', ylab = 'Frequency', main = 'Women',panel.first = grid())
Output
Histograms created with ggplot2
Functions ggplot and geom_histogram
This example code shows how to create two histograms with ggplot for the column Height. The ggplot graphs are saved as gg_m and gg_f and arranged in a grid. The properties of the plot (fill, color, labels) are set manually. In order to arrange the plots in a grid layout, the function grid.arrange from the package gridExtra is used.
library(ggplot2)library(gridExtra)df = read.csv("demo_data.csv")df_m = subset(df, df$Gender == "M") # mendf_f = subset(df, df$Gender == "F") # womenc = c("deepskyblue", "darkorange") # colorsgg_m = ggplot(df_m, aes(x = Height)) +geom_histogram(bins = 15, fill = c[1], color = "#000000") +labs(x = "Height", y = "Frequency") +ggtitle("Men")gg_f = ggplot(df_f, aes(x = Height)) +geom_histogram(bins = 15, fill = c[2], color = "#000000") +labs(x = "Height", y = "Frequency") +ggtitle("Women")grid.arrange(gg_m, gg_f, ncol = 2)
Output

When plotting only two variables of a data frame and specifying the attributes (labels, colors etc.) manually, the difference between graphics and ggplot2 is not that significant. The strength of ggplot2 is to create visualizations for dataframes with many variables, without having to extract and pre-process the variables, and then pass them as lenghty argument list to a plot function.
1-3 Scatter plots
| Top |
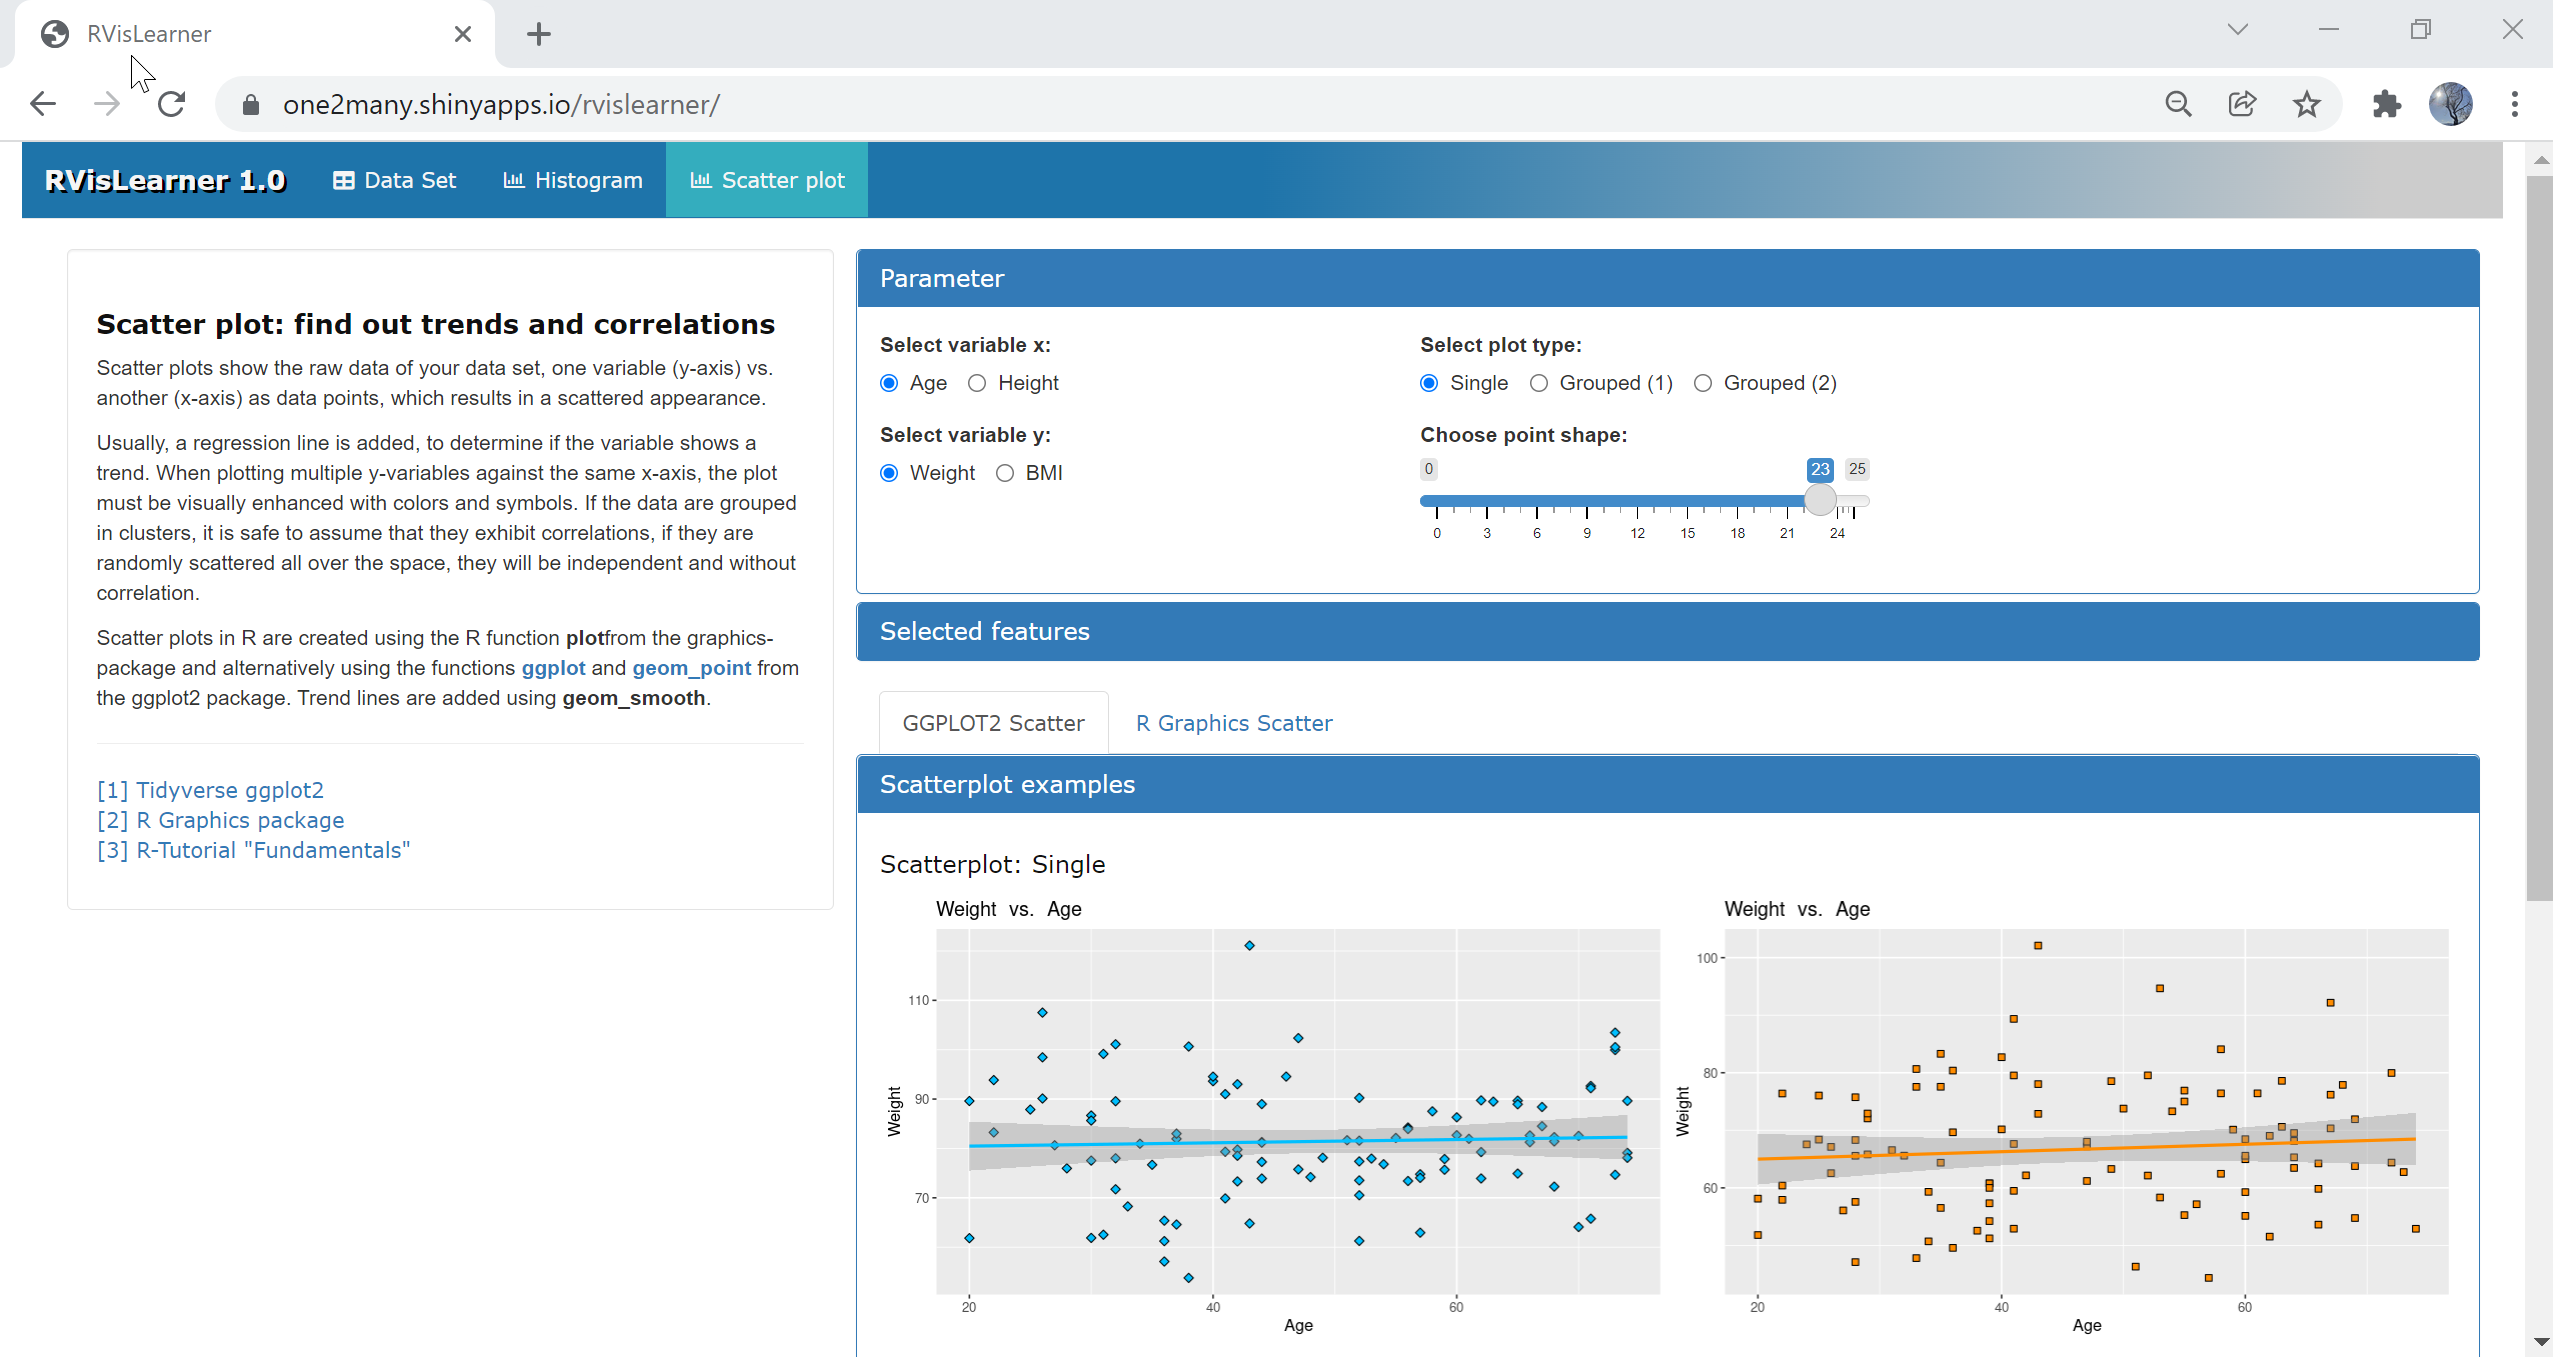
The third tab panel explains the creation of scatter plots for the example data set. Scatter plots show the raw data of your data set, one variable (y-axis) vs. another (x-axis) as data points, which results in a scattered appearance. Usually, a regression line is added, to determine if the variable shows a trend. When plotting multiple y-variables against the same x-axis, the plot must be visually enhanced with colors and symbols. If the data are grouped in clusters, it is safe to assume that they exhibit correlations, if they are randomly scattered all over the space, they will be independent and without correlation. Scatter plots in R are created using the R function plot from the graphics package and alternatively using the functions ggplot and geom_point from the ggplot2 package. With ggplot, trend lines are added using geom_smooth.
Tools & References
| Top |
This learning app assumes that you have basic knowledge of R syntax with RStudio as development environment. Here you find a selection of related links for looking deeper into these topics.
- [1] R Shiny shiny.rstudio.com/.
- [2] Tidyverse ggplot2 ggplot2.tidyverse.org.
- [3] R Graphics package rdocumentation.org/packages/graphics.
- [4] R-Tutorial "Fundamentals", this website evamariakiss.de/tutorial/r.
- [5] R-Tutorial (elab2go, in German) elab2go.de/demo-r1/.