BSTLearner - An interactive visualization of binary search trees
A binary search tree (BST) is a data structure used for storing, retrieving and sorting data in an efficient way
by using a binary tree structure with the property that the keys in a node’s left subtree are less and the keys in a node's
right subtree are greater than the key of the node itself, and then making it balanced.
This tutorial explains the usage and implementation of an interactive binary search visualization in Python using Graphviz and Jupyter Notebook Widgets. This is work in progress! To be finished as project work by students.
Motivation
Binary search trees are best understood using interactive visualizations that show how to insert / search / delete values in a tree, how to create a tree from random numbers, how to balance the tree by performing left and right rotations, traverse the tree etc. Jupyter Notebook visualizations are useful because they can be easily shared with students and combine documentation and code blocks in a natural way. With Jupyter Notebook you can use the Python interface for the Graphviz graph-drawing software and create trees by using the Digraph class. With Jupyter Notebook Widgets you can add interactions and create a GUI in which the binary search tree operations can be explored step-by-step.
1 BSTLearner Usage
| Top |
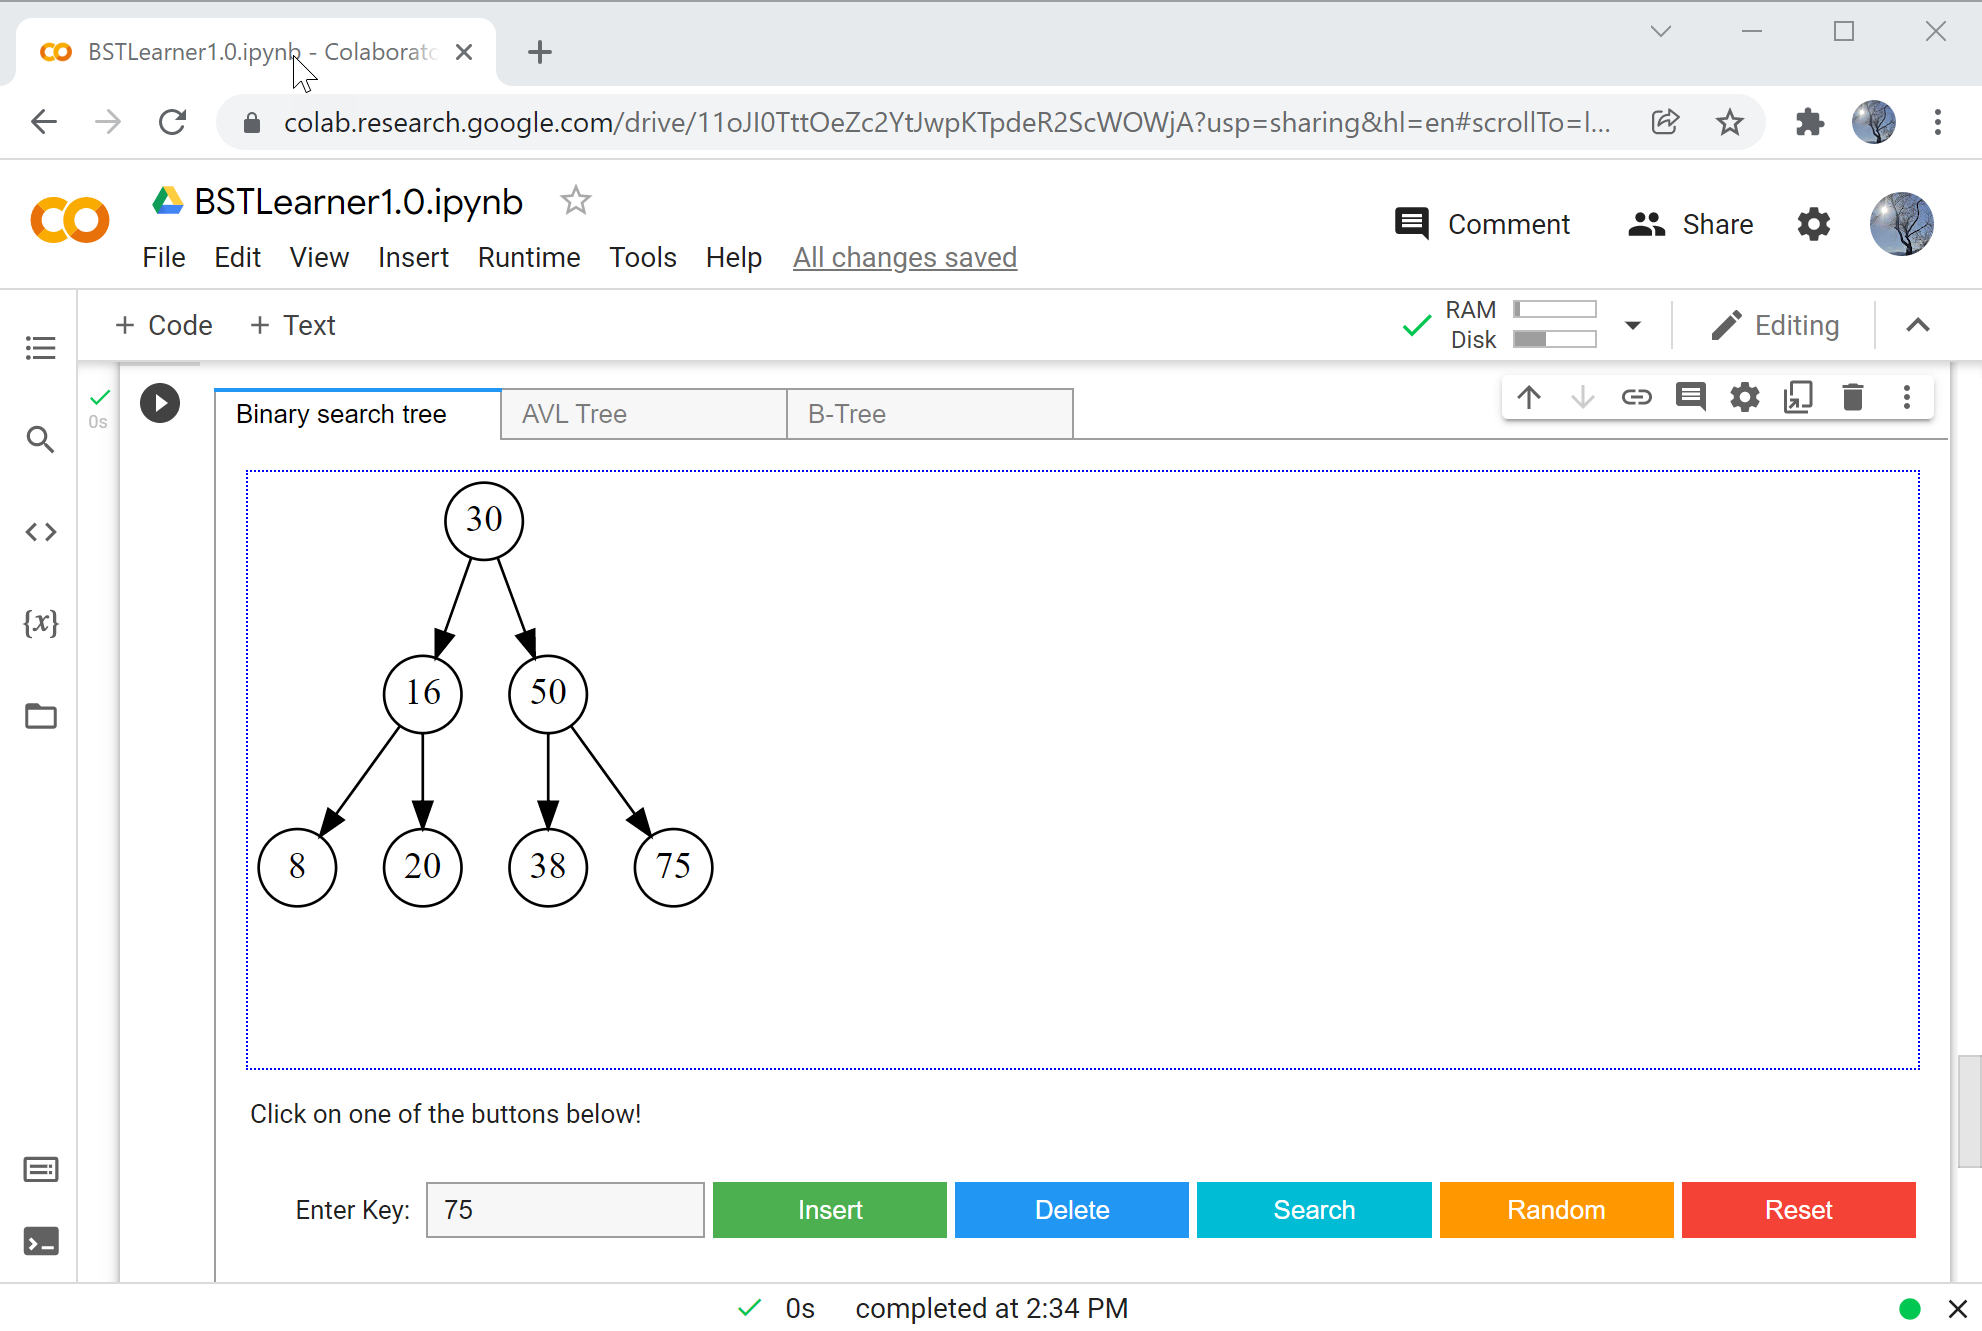
The BSTLearner app / Jupyter Notebook visualization has three tabs, the first one for binary search trees, the second one for AVL trees (self-balancing trees constructed by using a balancing factor and rotating the tree as needed to restore the balance), the third tab for B-Trees. You can create a new tree either step by step, by entering new keys in the Enter key field and then clicking "Insert", or by creating an entire tree from random numbers using the button Random. Single nodes are deleted using the Delete button, the entire tree is reset by using the Reset button.
2 BSTLearner Implementation
| Top |
The nodes of a binary search tree are created using the class TreeNode. Binary search trees are created, modified and visualized using the methods of the class BST. Before you start, the following tools must be installed on your computer: Python, Anaconda (with Jupyter Notebook), Graphviz. Graphviz is open source graph visualization software, that describes graphs in a simple text language ("DOT"), and creates graph and tree visualizations in a number of image formats and as PDF.
2-1 Required packages
For creating an interactive GUI in Jupyter Notebook we need the classes and methods of the ipywidgets-package, as well as graphviz and pydot for the tree visualization. The packages can be installed as usually using pip or conda commands, for example pip install graphviz or conda install graphviz.
import numpy as npfrom numpy.random import seed, randintimport ipywidgets as widgetsfrom ipywidgets import interact, interactive_output, HBox, VBox, Layoutfrom IPython.display import display, clear_output, SVG, HTMLimport graphviz as gv # for visualizing a tree using Digraphfrom graphviz import Digraphimport pydot
2-2 Class TreeNode
| Top |
First, the implementation requires a class TreeNode that implements a node of the tree and has four attributes:
- key: the key for the node, which in our case is an integer number
- parent: a pointer to the parent of a node
- left: a pointer to the left child of a node
- right: a pointer to the right child of a node
A binary search tree is created by linking nodes through the left and right pointers either to a left or to a right child. A node carries data, these are stored in the key attribute. The parent pointer is useful when deleting nodes. The method __init__ initializes the class on construction, the methods to_string and print are used for testing.
class TreeNode:def __init__(self, key):self.key = keyself.parent = Noneself.left = Noneself.right = Nonedef to_string(self):return str(self.key)def print(self):print("TreeNode: %d" % (self.key))n10 = TreeNode(10)n5 = TreeNode(5)n14 = TreeNode(14)# Create tree by linking the tree nodesn5.parent = n10; n14.parent = n10n10.left = n5 # left childn10.right = n14 # right childprint([n10.to_string(), n10.left.to_string(), n10.right.to_string()])
2-3 Class BST
| Top |
The class BST implements the methods to create a binary search tree.
- insert(k) inserts a node with key k in the tree.
- search() searches a node in the tree.
- delete(k) deletes the node with key k in the tree.
- transplant(self, u, v) replaces subtree u with subtree v and is needed as helper method when deleting nodes.
The implementation of the methods uses the pseudocode from Cormens "Introduction to Algorithms" [1]. Some of the methods are implemented recursively, for example, the search for a key or the tree travelsals.
class BST():def __init__(self):self.root = None # Root of the treeself.list = [] # Elements of the tree as listdef insert(self, k):''' Insert a key '''def search(self, x, k):''' Search for a key k starting at node x '''def find(self, k):return self.search(self.root, k)def transplant(self, u, v):''' Replace subtree u with subtree v '''def delete(self, k):'''Delete node with key k from tree '''def visualize(self, node = None):''' Visualize the tree using graphviz '''
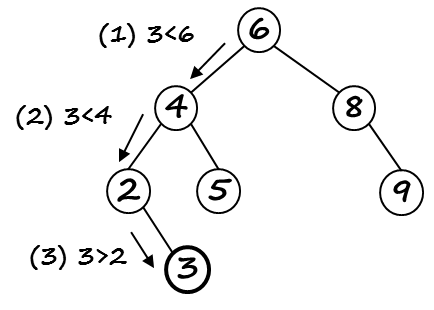
As illustration, we show the implementation of the TREE-SEARCH pseudocode given in Cormen [1] in Python. A recursive search for key k starting at a node x can be implemented using the following pseudocode: If the starting node x is null, we have reached a leaf and are done. If the search k equals the key of node x, we have found the node we searched for, and again, done. If the search key k is less than the key of node x, we continue recursively in the left subtree of x, else continue recursively in the right subtree of x.
Tree Search (Pseudocode)
Finding a key recursively
TREE-SEARCH(x, k)if x == NULL or k == x.keyreturn xif k < x.keyreturn TREE-SEARCH(x.left, k)elsereturn TREE-SEARCH(x.right, k)
Tree Search (Python)
Finding a key recursively
def search(self, x, k):'''Search for a key k starting at node x'''if (x == None or x.key == k):return xif (k < x.key):return self.search(x.left, k)else:return self.search(x.right, k)def find(self, k):return self.search(self.root, k)
Tree Visualization
The function visualize(tree, node) from the class BST creates a visualization of the tree recursively,
using the Digraph class from the graphviz package [3].
The parameter node is used to highlight a specific node, after it is found.
def visualize(self, node = None):''' Visualize the tree using graphviz '''tree = self.root# Recursively add nodes and edgesdef add_nodes_edges(tree, dot=None):col = "black"if dot is None:dot = Digraph() # Create Graphviz Digraphdot.node(name=str(tree), label=str(tree.key),color = col, shape="circle",fixedsize="True", width="0.4")# Add nodes recursivelyif tree.left:if (node != None and tree.left.key == node.key):col = "green"dot.node(name=str(tree.left), label=str(tree.left.key),color = col, shape="circle",fixedsize="True", width="0.4")dot.edge(str(tree), str(tree.left))dot = add_nodes_edges(tree.left, dot=dot)if tree.right:if (node != None and tree.right.key == node.key):col = "red"dot.node(name=str(tree.right), label=str(tree.right.key),color = col, shape="circle",fixedsize="True", width="0.4")dot.edge(str(tree), str(tree.right))dot = add_nodes_edges(tree.right, dot=dot)return dotreturn add_nodes_edges(tree)
3 Testing the implementation
| Top |
The implementation is followed by tests, in which we create a binary search tree and perform the implemented operations on it. We first test the BST class without using the interactive visualization with widgets, by creating a new tree, inserting /deleting some nodes and visualizing the tree after each step.
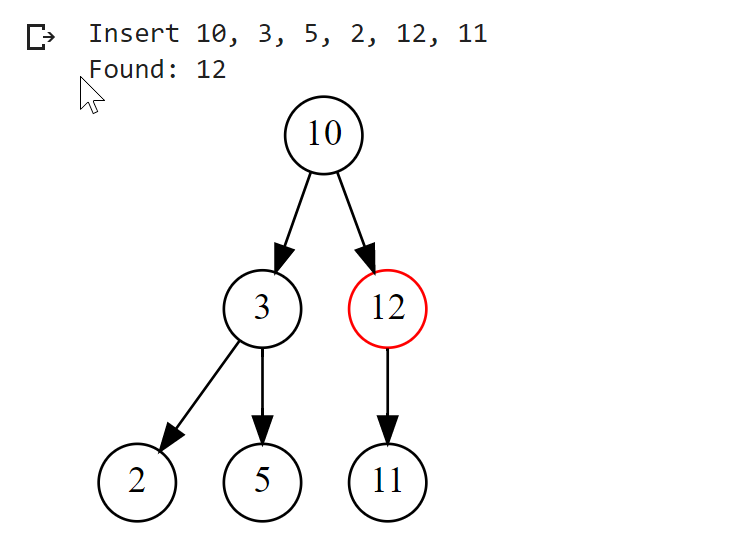
BST insert and find
Create a new tree and visualize it
bst = BST()print("Insert 10, 3, 5, 2, 12, 11")bst.insert(10)bst.insert(3)bst.insert(5)bst.insert(2)bst.insert(12)bst.insert(11)dot = bst.visualize()display(dot)node = bst.find(12)print("Found: " + node.to_string())dot = bst.visualize(node)display(dot)
Output
4 Interactive GUI with Jupyter Widgets
| Top |
The final step is to create an interactive GUI with Jupyter Widgets. Each type of tree (BST, AVL, B-Trees) will be placed in its own tab. Each tab will have an edit box where the keys can be entered manually, a display area for the tree and buttons for the different operations (insert key, generate tree from random numbers, delete key, reset).
(1) Create container widgets
Firstly, create the tabs and output widgets that will contain the other controls: input fields, buttons and tree visualization.
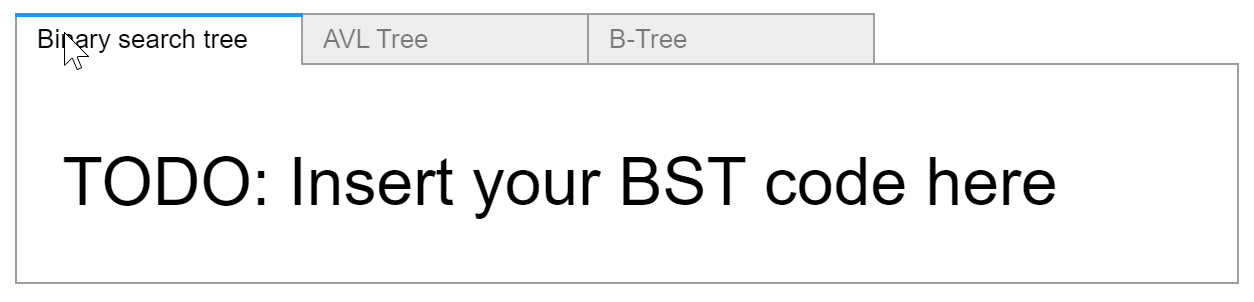
You can display the empty GUI structure by using display(tab), just to check that everyting looks fine.
import ipywidgets as widgetsfrom ipywidgets import Tab, HBox, VBox, Outputfrom ipywidgets import BoundedIntText, Button, HTML# Create tabs and output objectsout, out1, out2, out3 = Output(), Output(), Output(), Output()tab = Tab(children = [out1, out2, out3],layout=Layout(width='100%', height='auto'))tab.set_title(0, 'Binary search tree')tab.set_title(1, 'AVL Tree')tab.set_title(2, 'B-Tree')with out1:htm = HTML("TODO: Insert your BST code here")display(htm)with out2:htm = HTML("TODO: Insert your AVL code here")display(htm)with out3:htm = HTML("TODO: Insert your B-Tree code here")display(htm)display(tab)
The graphical user interface created with these containers should look something similar as in the screenshot. In the space indicated by the placeholder "TODO" we will position the widgets for each type of tree, for the first tab, that will be a Text widget for entering keys, some buttons for performing actions as needed, and the output containing the Graphviz tree.
(2) Create buttons and event handler
For each button we create an eventhandler for the click-event that implements
the actions to be performed after clicking that button.
At this point, we need an input field where we can enter the keys to be inserted in the tree or deleted from the tree.
The input field ui_key is created using the BoundedIntText-widget.
We also need to create a new tree instance using the BST-class, this is our underlying data structure that we access and modify
through the insert / delete / find etc. methods.
The eventhandler on_button_insert_clicked first clears the output, then calls the insert-method from
the BST-class with the argument ui_key.value from the input field, then creates a graphviz dot file
using the visualize-method from the BST-class and finally display the tree.
# Create new treetree = BST()# Input field for keysui_key = BoundedIntText(value=20, min=0, max=100,step=2, description='Enter Key:')# Create buttonbtn_insert = Button(description='Insert', button_style='success')def on_button_insert_clicked(b):with out:clear_output()tree.insert(ui_key.value)dot = tree.visualize()display(dot)btn_insert.on_click(on_button_insert_clicked)
(3) Place widgets on first tab
Finally, we put everything together: the output out1 for the first tab will be a VBox containing four other widgets:
the HBox displ containing the tree visualization out, a HTMl-widget htm that will display instructions for usage,
another HTML-widget msgbox for error messages and finally a HBox-widget ctrl grouping the buttons.
# Layout for display and controlslayout_displ=Layout(height='350px', border='1px dotted blue', overflow ='auto')layout_ctrl=Layout(height='50px')with out1:htm = HTML(msg)msgbox = HTML(" ")displ = HBox([out], layout=layout_displ)ctrl = HBox([ui_key, btn_insert], layout=layout_ctrl)display(VBox([displ, htm, msgbox, ctrl]))
After adding more buttons for the different tree operations, the first tab looks as displayed and the onclick-events for the buttons should work.
The only inconvenience with this GUI is that it is shown at the end of the Jupyter Notebook, after the rather lengthy class implementations and widgets definitions. It is however possible to hide the code cells and use the widget part as a regular GUI.
Tools & References
| Top |
For re-creating this visualization, the following tools must be installed on your computer: Python, Anaconda (with Jupyter Notebook), Graphviz. Graphviz is open source graph visualization software, that describes graphs in a simple text language ("DOT"), and creates graph and tree visualizations in a number of image formats and as PDF.
Or, you can skip the local installations and simply develop and run the Juypter Notebook as Google Colab script in the Cloud.
- [1] Cormen, Leiserson, Rivest, Stein: Introduction to Algorithms.
- [2] W3Schools: Classes in Python.
- [3] Graphviz Digraph.
- [4] Jupyter Notebook Widgets.